

Is your shared link showing the wrong image, an old title, or—even worse—no preview at all? You only get one chance to make a first impression in the feed. These seven professional Facebook Debugger tricks will ensure your content looks polished, clickable, and perfectly formatted every single time you post.
The Facebook Debugger (or Facebook Sharing Debugger) is a free developer tool used to preview, troubleshoot, and update how your website content appears when shared on Facebook and Messenger. By entering a URL, you force Facebook’s “crawler” to refresh its cached data, ensuring your latest titles, descriptions, and images display correctly to your audience.
Find More: 5 Powerful Tools to Download VK Videos in HD Quality
What is the Facebook Debugger?
Before diving into the tricks, let’s define the tool. The Facebook sharing debugger is a utility provided by Meta that acts as a bridge between your website’s code and Facebook’s display engine. When you share a link, Facebook doesn’t just “look” at your page in real-time; it stores a snapshot of your data (title, image, description) in a temporary storage area called a cache.
The debugger Facebook tool allows you to see exactly what is in that snapshot. If you change a featured image on your blog but Facebook still shows the old one, the debugger is the only way to “tell” Facebook to go back to your site and look again. It relies on Open Graph (OG) meta tags, which are snippets of code that tell social media platforms how to interpret your content.
How the Facebook Crawler Works
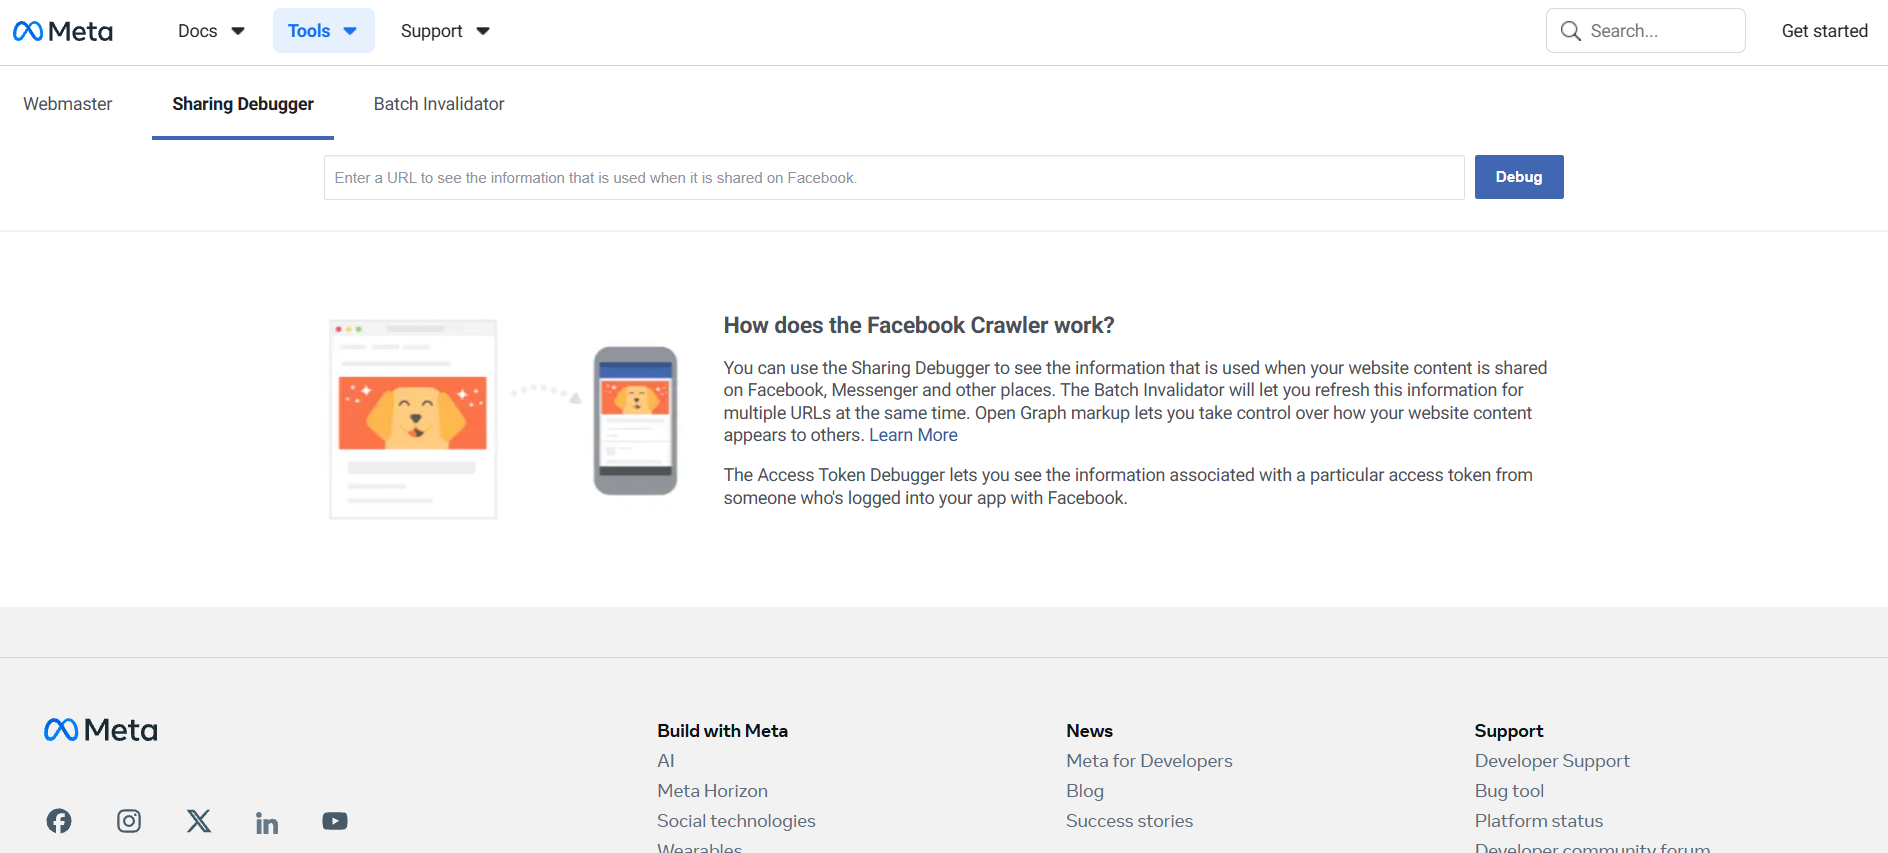
To use the tool effectively, you must understand the “Crawler.” This is an automated bot from Meta that visits your URL. It ignores your paragraphs and sidebar ads; instead, it looks specifically for <meta property="og:..." /> tags in your site’s HTML header. If these tags are missing, Facebook tries to “guess” which image to use, which often results in cropped heads, blurry logos, or empty boxes.
Trick 1: The “Scrape Again” Power Move
The most common mistake beginners make is clicking “Debug” once and expecting the problem to fix itself. If you’ve just updated your website, the first result you see in the debugger is likely the old data Facebook already has stored.
The Step-by-Step Refresh Framework
- Copy the URL of the page you want to fix.
- Navigate to the Facebook Sharing Debugger.
- Paste your link and click Debug.
- Look at the “Time Scraped” section. If it’s not from “just now,” click the Scrape Again button.
- If the image still doesn’t update, click Scrape Again a second or third time. It often takes multiple “pokes” to clear the CDN cache across all of Meta’s global servers.
Trick 2: Validate Your Image Aspect Ratio Instantly
Nothing kills a click-through rate faster than a pixelated or awkwardly cropped image. Facebook prefers a very specific “Golden Ratio” for link previews. If your image is a square, Facebook might shrink it into a tiny thumbnail next to your text rather than display it as a large, immersive card.
Pro Tip: The 1.91:1 Rule
To get the “Stunning” look, your image must be 1200 x 630 pixels. In the Facebook debugger, look at the “Link Preview” section. If you see a small square image on the left, your og image is too small. By ensuring your image reaches 1200px in width, the debugger will show you a full-width preview, which has historically generated 60% more engagement than thumbnail previews.
Trick 3: Fixing the “Inferred Property” Warning

When you run a URL through the debugger Facebook tool, you might see a yellow warning icon saying “Inferred Property.” This means Facebook had to guess your content type because your code was incomplete.
Common Inferred Properties Include:
-
og:image: Facebook grabbed the first image it found (usually your logo).
-
og:title: Facebook used your internal
<title>tag instead of a curated social title. -
og:description: Facebook pulled the first sentence of your blog, which might just be “Welcome to my site.”
To fix this, use a plugin like Yoast SEO (WordPress) or the SEO settings in Shopify/Wix to explicitly set these tags. Then, return to the debugger and “Scrape Again” to turn those yellow warnings into green successes.
Trick 4: The Batch Clearing Secret (For Large Sites)
What if you changed your site’s branding and 50 different blog posts now have the wrong logo? Manually debugging 50 links is a nightmare. Most beginners don’t know about the Batch Invalidator.
Inside the for developers section, you can use the Batch Invalidator to submit up to 50 URLs at once. This forces a mass refresh of Meta’s cache for your entire site. This is a “hidden” trick because it’s tucked away in a different tab, but it saves hours of manual labor for growing creators.
Trick 5: Debugging the “Missing App ID” Error
You will almost always see a warning that says “The ‘fb:app_id’ property should be explicitly provided.” Many beginners panic here, thinking their site is broken.
Expert Insight: Unless you are using Facebook Insights for Domains or advanced tracking, you can actually ignore this warning. It does not affect how your post looks. However, if you want a “perfect” score in the Facebook sharing debugger, you can create a basic Meta App in the Developer Portal and add the ID to your site’s <head>. This adds a layer of authority to your domain in the eyes of Facebook’s algorithm.
Trick 6: Testing “Dark Mode” and Messenger Previews
In 2026, more than 70% of users view Facebook in Dark Mode. A trick to making your posts look “stunning” is checking how your image transparency behaves. If you use a transparent PNG for your og: image with dark text, it will be invisible to users in Dark Mode.
While the Facebook debugger shows a standard white background preview, you can “hack” a test by sending the link to yourself in a private Messenger desktop window after you’ve scraped it. Messenger uses the same cache as the debugger. If it looks bad there, go back to your site and add a solid background color to your featured image.
Trick 7: Using the “Input URL” vs. “Canonical URL”

Sometimes, you might be debugging mysite.com/blog-post/, but Facebook says it’s looking at mysite.com/blog-post/?ref=newsletter. This creates a split in your engagement data.
In the facebook sharing debugger, check the “Canonical URL” field. If it doesn’t match your main link, you have a redirect or a tagging issue on your site. Use the og:url tag to tell Facebook exactly which version of the link is the “source of truth.” This ensures all likes and shares are consolidated onto one single URL, boosting your social proof.
Real-World Example: The “Ghost Image” Fix
Imagine you publish a post with a typo in the title. You fix it on your website, but when you share it on Facebook, the typo is still there.
-
The Mistake: Deleting and re-posting the link on Facebook. (Facebook will just pull the same cached typo).
-
The Fix: Run the URL through the Facebook debugger, click “Scrape Again” until the preview shows the corrected title, and then post it on your timeline.
Comparison: Facebook Debugger vs. Other Social Tools
| Feature | Facebook Debugger | LinkedIn Post Inspector | Twitter/X Card Validator |
| Primary Tag | Open Graph (og:) | Open Graph (og:) | Twitter Cards |
| Manual Refresh | Yes (Scrape Again) | Yes (Automatic on Inspect) | Limited |
| Image Preview | Large & Thumbnail | Large only | Large & Small |
| Validation | Detailed Warnings | Basic | Minimal |
Common Mistakes to Avoid
-
Ignoring Image Size: Using an image under 200x200px will cause the debugger to fail entirely.
-
Caching Plugins: If you use WP Rocket or Cloudflare, you must clear those caches before clicking “Scrape Again” in the debugger, or Facebook will just keep seeing the old cached version of your site.
-
Broken Links: If your page is in “Draft” mode or behind a password, the crawler cannot see it, and the debugger will return a 404 error.
Key Takeaways
-
Force Refresh: Use the “Scrape Again” button to update old images and titles.
-
The 1200×630 Rule: Use these dimensions for high-quality, full-width link cards.
-
Check OG Tags: Ensure your website has
og:image,og:title, andog:descriptionproperly set. -
Ignore App ID: Don’t worry about the App ID warning unless you need advanced analytics.
-
Batch Refresh: Use the Batch Invalidator for site-wide updates.
Find More: Boost Your Sales With SEO Services
FAQs
1. Why is the Facebook Debugger not updating my image?
The most common reason is your website’s internal cache or a server-side cache (like Cloudflare). The facebook debugger can only see what your server sends it. Clear your website cache first, then hit “Scrape Again” in the debugger tool.
2. What is the best image size for the Facebook Sharing Debugger?
The optimal size is 1200 x 630 pixels. This ensures a 1.91:1 aspect ratio, which allows for a high-resolution, full-width preview on both mobile and desktop feeds.
3. How long does the Facebook cache last?
Facebook typically refreshes its cache every 30 days automatically. However, if you update your content, you should manually use the debugger facebook tool to trigger an immediate update.
4. Can I debug a local URL (localhost)?
No, the facebook sharing debugger needs to access a live, public URL. To test a local site, you would need to use a tool like Ngrok to create a public tunnel to your local environment.
5. Does the Facebook Debugger affect SEO?
Indirectly, yes. While it doesn’t change your Google ranking, it significantly impacts your “Social SEO.” A professional-looking link gets more clicks and shares, which sends positive signals to search engines about your content’s quality.
Ready to make your content look incredible?
Head over to the